
At the January 2011 ASQ Section 800 meeting, held at the Polaris Career Center in Middleburgh Heights, Ohio, Robert Skillman, a Certified Lean Six Sigma Master Black Belt and Lean Sensei, gave a talk on "How To Think About Data."
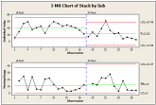
Bob began the session with a statement, "Scrap is up 20% from last month." He then asked everyone how they would react to that statement if it was directed at them by a supervisor. After entertaining a number of reactions, Bob stated his reaction, "What is special about last month." This transitioned into a discussion of signals and how and when we should react to them.
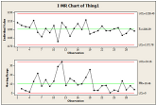
Bob then introduced the Control Chart, a tool invented by Walter A. Shewhart, while working for Bell Labs in the 1920s, as a way of determining if our process is sending us a signal which needs attention. The signal we are looking for in the control chart is whether or not our process is stable. Bob defined a stable process as one that did not display special cause variation. Bob defined the two types of variation:
Special Cause Variation: Any excursions beyond the control limits (behavior limits) on a control chart. The control limits are set at plus or minus three standard deviations from the average.
Common Cause Variation: All data that is contained within the control limits on the control chart.
Bob indicated that the intrusion of special cause variation in a process has a detrimental impact on both the average (mean) and variation (standard deviation). Consequently, any special cause variation that is identified in the process needs to be analyzed as to cause and removed from the analysis. Bob emphasized that special cause variation cannot be removed until its source is identified and verified as something out of the ordinary.
Bob cautioned that when using a control chart to detect the presence of special cause variation in random data, any trends or patterns are meaningless. However, if we are analyzing time-series data, trends and patterns may be a signal of abnormal behavior or changes in the process. Bob discussed the interpretation and remedies of the various types of patterns, which may be identified during analysis. Since time-series data is more insightful with respect to process behavior, it is preferred.
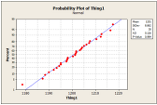
Bob also pointed out that many of the statistical analysis tools we have available not only needs stable data but also normal data. In order to determine the normality of the data, Bob introduced the Anderson-Darling test. This test confirms normality if the P-Value is greater than 0.05, otherwise, it is not normal.
Bob discussed the importance of understanding the contribution of measurement system variation in the analysis of the process. Excessive measurement variation can mask the process variation. Completing a Measurement System Analysis (MSA) will quantify the ability of the measurement system to detect signals in the process.
Next, Bob used two case studies to illustrate the presence of signals and the impact of noise during an analysis. The first analysis compared the home run production of Babe Ruth and Roger Maris. We learned that Babe Ruths sixty (60) home runs in 1927 were normal and not a signal. In fact, if the Babe would have hit 70 home runs, it would still be statistically normal behavior based on his career data. With Roger, the 61 home runs in 1961 were quite exceptional and most likely would not repeat.
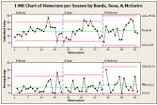
The second case compared the home run production of Barry Bonds, Sammy Sosa and Mark McGuire. We learned the following:
- Barry Bonds' 73-homerun season was clearly a Special Cause
- Sosas 66- and 64-homerun seasons are Special Causes, but not by much. It appears to cap off a definite upward trend.
- McGwires 70-homerun season was part of Common Cause
In the second case, Bob explored the idea of noise in the analysis. He defined noise as those variables that could cause variation but were not being analyzed. For example, what if a player was injured and played very little during the season? This was not detectable the way the data was currently being analyzed and could result in incorrect conclusions. This noise was addressed by looking at the data based upon the number of times at bat.
Bob concluded with the following observations:
- Data is frequently used to detect signals that require action.
- Far too often action is taken when no signal exists.
- Conversely, action frequently is not taken when it should be.
- Remedial actions regarding Common Causes are very different than actions taken to remedy Special Causes.
- It is important to filter out as much noise as possible.
- Filtering noise is accomplished through various analysis methods and sampling strategies.
- Data should always be presented in such a way that preserves the evidence in the data for all the predictions that might be made from these data.
- Resist being held accountable for fluctuations in data unrelated to Special Causes.
- Common Cause reflects the natural signature of the process. If this is not acceptable, then systemic changes must be made.
After a period of questions and answers, the meeting ended.