|
THE KAVON RESOURCE CENTER
 |
Glossary of Terms
The Glossary Of Terms provide definitions to commonly used words in various business environments.
You can view glossary terms by Term, Acronym, Category, or as a Complete List of Terms or a Complete List of Aconyms.
If you have any other terms that you would like us to include, contact us and we will consider adding it to our glossary. |
14 Principles Of The Toyota Way |
|
According to Liker, the 14 principles of The Toyota Way are organized in four sections: I) Long-Term Philosophy, II) The Right Process Will Produce the Right Results, III) Add Value to the Organization by Developing Your People, and IV) Continuously Solving Root Problems Drives Organizational Learning. The principles are set out and briefly described below:
Section I Long-Term Philosophy
Principle 1: Base your management decisions on a long-term philosophy, even at the expense of short-term financial goals.
People need purpose to find motivation and establish goals.
Section II The Right Process Will Produce the Right Results
Principle 2: Create a continuous process flow to bring problems to the surface.
Work processes are redesigned to eliminate waste (muda) through the process of continuous improvement kaizen. The seven types of muda are:
- Overproduction
- Waiting (time on hand)
- Unnecessary transport or conveyance
- Overprocessing or incorrect processing
- Excess inventory
- Motion
- Defects
Principle 3: Use "pull" systems to avoid overproduction.
A method where a process signals its predecessor that more material is needed. The pull system produces only the required material after the subsequent operation signals a need for it. This process is necessary to reduce overproduction.
Principle 4: Level out the workload (heijunka). (Work like the tortoise, not the hare).
This helps achieve the goal of minimizing waste (muda), not overburdening people or the equipment (muri), and not creating uneven production levels (mura).
Principle 5: Build a culture of stopping the production line to fix problems, to get quality right the first time.
Quality takes precedence (Jidoka). Any employee in the Toyota Production System has the authority to stop the process to signal a quality issue.
Principle 6: Standardized tasks and processes are the foundation for continuous improvement and employee empowerment.
Although Toyota has a bureaucratic system, the way that it is implemented allows for continuous improvement (kaizen) from the people affected by that system. It empowers the employee to aid in the growth and improvement of the company.
Principle 7: Use visual control so no problems are hidden.
Included in this principle is the 5S Program - steps that are used to make all work spaces efficient and productive, help people share work stations, reduce time looking for needed tools and improve the work environment.
- Sort: Sort out unneeded items
- Straighten: Have a place for everything
- Shine: Keep the area clean
- Standardize: Create rules and standard operating procedures
- Sustain: Maintain the system and continue to improve it
Principle 8: Use only reliable, thoroughly tested technology that serves your people and processes.
Technology is pulled by manufacturing, not pushed to manufacturing.
Section III Add Value to the Organization by Developing Your People
Principle 9: Grow leaders who thoroughly understand the work, live the philosophy, and teach it to others.
Without constant attention, the principles will fade. The principles have to be ingrained, it must be the way one thinks. Employees must be educated and trained: they have to maintain a learning organization.
Principle 10: Develop exceptional people and teams who follow your company's philosophy.
Teams should consist of 4-5 people and numerous management tiers. Success is based on the team, not the individual.
Principle 11: Respect your extended network of partners and suppliers by challenging them and helping them improve.
Toyota treats suppliers much like they treat their employees, challenging them to do better and helping them to achieve it. Toyota provides cross functional teams to help suppliers discover and fix problems so that they can become a stronger, better supplier.
Section IV Continuously Solving Root Problems Drives Organizational Learning
Principle 12: Go and see for yourself to thoroughly understand the situation (Genchi Genbutsu).
Toyota managers are expected to "go-and-see" operations. Without experiencing the situation firsthand, managers will not have an understanding of how it can be improved. Furthermore, managers use Tadashi Yamashima's (President, Toyota Technical Center (TTC)) ten management principles as a guideline:
- Always keep the final target in mind.
- Clearly assign tasks to yourself and others.
- Think and speak on verified, proven information and data.
- Take full advantage of the wisdom and experiences of others to send, gather or discuss information.
- Share information with others in a timely fashion.
- Always report, inform and consult in a timely manner.
- Analyze and understand shortcomings in your capabilities in a measurable way.
- Relentlessly strive to conduct kaizen activities.
- Think "outside the box," or beyond common sense and standard rules.
- Always be mindful of protecting your safety and health.
Principle 13: Make decisions slowly by consensus, thoroughly considering all options; implement decisions rapidly (nemawashi).
The following are decision parameters:
- Find what is really going on (go-and-see) to test
- Determine the underlying cause
- Consider a broad range of alternatives
- Build consensus on the resolution
- Use efficient communication tools
Principle 14: Become a learning organization through relentless reflection (hansei) and continuous improvement (kaizen).
The process of becoming a learning organization involves criticizing every aspect of what one does. The general problem solving technique to determine the root cause of a problem includes:
- Initial problem perception
- Clarify the problem
- Locate area/point of cause
- Investigate root cause (5 whys)
- Countermeasure
- Evaluate
- Standardize
|
| Source: "The Toyota Way" Wikipedia http://en.wikipedia.org. Web. 26 July 2011.
http://en.wikipedia.org/wiki/The_Toyota_Way
|
|
|
|
4 Disciplines of Execution |
|
- Focus on the Wildly Important
- Create a Compelling Scoreboard
- Translate Lofty Goals into Specific Actions
- Hold Each Other Accountable All the Time
|
| Source: Stephen R. Covey, The 4 Disciplines of Execution (Revised Edition): The Secret to Getting Things Done, On Time, With Excellence, Franklin Covey Co. 2004.
|
|
|
|
5S |
|
One of the lean tool sets for creating work place organization (Sort, Straighten, Shine, Standardize, and Sustain). |
|
|
|
|
5S+1 |
|
One of the lean tool sets for creating work place organization including safety (Sort, Straighten, Shine, Standardize, and Sustain + Safety). |
|
|
|
|
7 Habits Of Highly Effective People |
|
- Be Proactive: Taking initiative in life by realizing your decisions (and how they align with life's principles) are the primary determining factor for effectiveness in your life. Taking responsibility for your choices and the subsequent consequences that follow. Getting things done.
- Begin With The End In Mind: Self-discover and clarify your deeply important character values and life goals. Envision the ideal characteristics for each of your various roles and relationships in life. It is always better to try and foresee situations. Predict outcomes and then think of worst case scenarios, will help come up with informed decisions.
- Put First Things First: Planning, prioritizing, and executing your week's tasks based on importance rather than urgency. Evaluating if your efforts exemplify your desired character values, propel you towards goals, and enrich the roles and relationships elaborated in Habit 2. Prioritization is the key to the success of any business or in any walk of life. Being proactive rather than being reactive leads to success.
- Think Win/Win: Genuinely striving for mutually beneficial solutions or agreements in your relationships. Valuing and respecting people by understanding a "win" for all is ultimately a better long-term resolution than if only one person in the situation had gotten his way. Everyone will feel inclusive and involved. A better environment of trust and loyalty establishes.
- Seek First To Understand, Then To Be Understood: Using empathetic listening to be genuinely influenced by a person, which compels them to reciprocate the listening and take an open mind to being influenced by you. This creates an atmosphere of caring, respect, and positive problem solving. This can also avoid situations where the problem does not actually exist and its just a matter of misunderstanding. It is always said that listen double to what you talk since we have 2 ears to listen and one mouth to talk.
- Synergize: Combining the strengths of people through positive teamwork, so as to achieve goals no one person could have done alone. How to yield the most prolific performance out of a group of people through encouraging meaningful contribution, and modeling inspirational and supportive leadership. Everyone is a master of something and not everything. Positive potentials can be put together to achieve better results.
- Sharpen The Saw: The balancing and renewal of your resources, energy, and health to create a sustainable long-term effective lifestyle. This is constant improvement of one's self in order to be a better human being and to sharpen one's skills in order to achieve better results.
|
| Source: Stephen R. Covey, The 7 Habits of Highly Effective People, Franklin Covey Co. 1989, p. 11.
|
|
|
|
7 Tools Of Quality |
|
The Seven (7) Tools of Quality are:
- Check Sheets: Form for entering data under predetermined catagories.
- Control Chart: A line graph with an average line and contol limit lines.
- Cause-And-Effect (Fishbone) Diagrams: Shows cause and effect relationships.
- Flow Charts: Symbols to show steps in a process.
- Histograms: Bar chart showing data set divided into classes (bars) of equal width. Height of bar shows quantity.
- Pareto Diagrams: A bar chart with percent arranged so bars touch. Bars are in descending order from the left.
- Scatter Diagrams: Chart where data for x and y variables are entered as dots to see if they form a pattern.
|
|
|
|
|
8D Process |
|
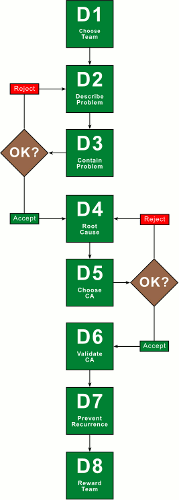 The 8D Process is a problem solving method for product and process improvement. It is structured into 8 steps (the D's) and emphasizes team. This is often required in automotive industries. The 8 basic steps are: Define the problem and prepare for process improvement, establish a team, describe the problem, develop interim containment, define & verify root cause, choose permanent corrective action, implement corrective action, prevent recurrence, recognize and reward the contributors.
Of course, different companies have their different twists on what they call the steps, etc...but that is the basics.
8 D is short for Eight Disciplines which Originated from the Ford TOPS (Team Oriented Problem Solving) program. (First published approximately 1987).
- D#1 - Establish the Team
- D#2 - Describe the problem
- D#3 - Develop an Interim Containment Action
- D#4 - Define / Verify Root Cause
- D#5 - Choose / Verify Permanent Corrective Action
- D#6 - Implement / Validate Permanent Corrective Action
- D#7 - Prevent Recurrence
- D#8 - Recognize the Team
|
|
|
|
|
Active Implantable Medical Device |
|
Active medical device which is intended to be totally or partially introduced, surgically or medically, into the human body or by medical intervention into a natural orifice, and which is intended to remain after the procedure. |
| Source: ISO. ISO 13485:2003 - Medical devices Quality management
systems Requirements for regulatory purposes. Genevea, Switzerland: ISO, 15 July 2003. PDF.
|
|
|
|
Active Medical Device |
|
Medical device relying for its functioning on a source of electrical energy or any source of power other than that directly generated by the human body or gravity. |
| Source: ISO. ISO 13485:2003 - Medical devices Quality management
systems Requirements for regulatory purposes. Genevea, Switzerland: ISO, 15 July 2003. PDF.
|
|
|
|
Analysis Of Variance |
|
A statistical method to determine if a statistical difference is detectable between the averages of multiple samples. |
|
|
|
|
Andon |
|
A visual control device in a production area, typically a lighted overhead display, giving the current status of the production system and alerting team members to emerging problems. |
|
|
|
|
Automotive Industry Action Group |
|
The AIAG (Automotive Industry Action Group) is a non-profit association of automotive companies founded in 1982. |
|
|
|
|
Available Work Time |
|
The amount of time per shift at a process (in seconds, minus breaks, meetings, and cleanup time). |
|
|
|
|
Batch & Queue |
|
Product waiting it's turn for the next manufacturing process. |
|
|
|
|
Benchmarking |
|
Benchmarking is a strategy of copying the best practice of a company that excels at a given business function. The company doesn't even have to be in the same industry: a wide, braod-based comparison can be used. |
| Source: Peter Mears, Quality Improvement - Tools & Techniques, McGraw-Hill, Inc. 1995, p. 155.
|
|
|
|
Buffer |
|
A maintained supply of parts, in a specific area for the singular purpose of dealing with fluctuations in the customer demand rate. |
|
|
|
|
Change Over Time (C/O) |
|
The time taken to switch from producing one product type to another. |
|
|
|
|
Check Sheet |
|
The check sheet is a simple document that is used for collecting data in real-time and at the location where the data is generated. The document is typically a blank form that is designed for the quick, easy, and efficient recording of the desired information, which can be either quantitative or qualitative. When the information is quantitative, the check sheet is sometimes called a tally sheet.
A defining characteristic of a check sheet is that data is recorded by making marks ("checks") on it. A typical check sheet is divided into regions, and marks made in different regions have different significance. Data is read by observing the location and number of marks on the sheet. Five (5) Basic types of Check Sheets:
- Classification: A trait such as a defect or failure mode must be classified into a category.
- Location: The physical location of a trait is indicated on a picture of a part or item being evaluated.
- Frequency: The presence or absence of a trait or combination of traits is indicated. Also number of occurrences of a trait on a part can be indicated.
- Measurement Scale: A measurement scale is divided into intervals, and measurements are indicated by checking an appropriate interval.
- Check List: The items to be performed for a task are listed so that, as each is accomplished, it can be indicated as having been completed.
|
| Source: "Check Sheet" Wikipedia http://en.wikipedia.org. Web. 28 July 2011.
http://en.wikipedia.org/wiki/Check_sheet
|
|
|
|
Color Associations |
|
The color selected for presentations affects our audience subconsciously and communicates subliminal signal about mood. The following are some of the common meanings we associate with different colors:
| Color |
Association |
| Black |
Authority, Death, Strength, Loyalty, Mystery |
| Blue |
Dependability, Faith, Cold, Award, Truth, Tenderness |
| Brown |
Action, Earthiness, Autumn, Fellowship |
| Green |
Envy, Health, Friendship, Leisure, Youthfulness |
| Red |
Power, Passion, Heat, Excitement, Love, Fulfillment |
| Orange |
Warmth, Action, Power, Valor, Aggression, Fury |
| Purple |
Dignity, Royalty, Frugality, Melancholy |
| White |
Holiness, Cleanliness, Purity, Professionalism |
| Yellow |
Confidence, Knowledge, Esteem, Playfulness, Friendly |
|
| Source: Harry Mills, Power Points! How to DESIGN & DELIVER Presentations That Sizzle and Sell, AMACOM 2007, p. 105.
|
|
|
|
Color Interpretations |
|
The following table shows how different audiences interpret colors:
| Color |
Movie Audience |
Financial Managers |
Health Care Professionals |
Control Engineers |
| Blue |
Tender |
Corporate, Reliable |
Dead |
Cold, Water |
| Cyan |
Leisurely |
Cool, Subdued |
Cyanotic, Deprived of oxygen |
Steam |
| Green |
Playful |
Profitable |
Infected, Bilious |
Nominal, Safe |
| Yellow |
Happy |
Highlighted Item, Important |
Jaundiced |
Caution |
| Red |
Exciting |
Unprofitable |
Healthy |
Danger |
| Magenta |
Sad |
Wealthy |
Cause for concern |
Hot, Radioactive |
|
| Source: Gerald E. Jones, How to Lie With Charts, Sybex 1995, p. 205.
|
|
|
|
Concurrent Engineering |
|
The simultaneous performance of product design and process design. Typically, concurrent engineering involves the formation of cross-functional teams. This allows engineers and managers of different disciplines to work together simultaneously in developing product and process designs. |
|
|
|
|
Constraint |
|
Any element or factor that prevents a system from achieving a higher level of performance relative to its goal. Constraints can be physical/logistical, managerial/procedural or behavioral/psychological. |
| Source: "Constraint" Pinnacle Strategies http://www.pinnacle-strategies.com. Web. 04 October 2011.
http://www.pinnacle-strategies.com/Theory%20of%20Constraints%20glossary.htm#c1
|
|
|
|
Control Chart |
|
A Control Chart is used to identify statistically significant changes that may occur in a process. These changes, called variations, are inherent in all processes and result in variations in the products produced and the services offered. The variation may be large or very small, but it is always present. The trick is to identify the variation and either eliminate it or reduce the variation to a minimum. |
| Source: Peter Mears, Quality Improvement - Tools & Techniques, McGraw-Hill, Inc. 1995, p. 67.
|
|
|
|
Crosby's Four Absolutes Of Quality Management |
|
- Quality means conformance to requirements. Requirements needed to be clearly specified so that everyone knew what was expected of them.
- Quality comes from prevention. And prevention was a result of training, discipline, example, leadership and more.
- Quality performance standard is zero defects. Errors should not be tolerated.
- Quality measurement is the price of nonconformnace.
|
|
|
|
|
Crosby's Fourteen Points |
|
- Make it clear that management is committed to quality.
- Form quality improvement teams with representatives form each department.
- Determine where current and potential quality problems lie.
- Evaluate the cost of quality and explain its use as a management tool.
- Raise the quality awareness and personal concern of all employees.
- Take actions to correct problems identified through previous steps.
- Establish a committee for the zero defects programme.
- Train supervisors to actively carry out their part of the quality improvement programme.
- Hold a "zero defects day" to let all employees realize that there has ben a change.
- Encourage individuals to establish improvement goals for themselves and their groups.
- Encourage employees to communicate to management the obstacles they face in attaining their improvement goals.
- Recognize and appreciate those who participate.
- Establish quality councils to communicate on a regular basis.
- Do it all over again to emphasize that the quality improvement programme never ends.
|
|
|
|
|
Customer Demand Rate |
|
The amount of pieces required by the customer each day. |
|
|
|
|
Cycle Time (C/T) |
|
Time lapses between one part coming off the process to the next part coming off, in seconds. How often a part or product actually is completed by a process, as timed by observation. Also, the time it takes an operator to go through all of their work elements before repeating them. |
|
|
|
|
Degrees of Freedom |
|
The amount of information available for the estimate of variability after calculating the mean. One piece of data, 0 degrees of freedom, 3 pieces of data 2 degrees of freedom, therefore, n-1. Degrees of freedom are referred to as v. |
|
|
|
|
Deming's 14 Principles Of Management |
|
W. Edwards Deming's Fourteen Principles Of Management
- Create constancy of purpose towards improvement of product and service, with the aim to become competitive, stay in business, and to provide jobs.
- Adopt the new philosophy. We are in a new economic age. Western management must awaken to the challenge, must learn their responsibilities, and take on leadership for change.
- Cease dependence on inspection to achieve quality. Eliminate the need for inspection on a mass basis by creating quality into the product in the first place.
- End the practice of awarding business on the basis of price tag. Instead minimize total cost. Move towards a single supplier for any one item, on a long term relationship of loyalty and trust.
- Improve constantly and forever the system of production and service, to improve quality and productivity, and thus constantly decrease costs.
- Institute training on the job.
- Institute leadership (see point 12.) The aim of leadership should be to help people and machines and gadgets to do a better job. Leadership of management is in need of overhaul, as well as leadership of production workers.
- Drive out fear so that everyone may work effectively for the company.
- Break down barriers between departments. People in research, design, sales, and production must work as a team, to foresee problems of production and in use that may be encountered with the product or service.
- Eliminate slogans, exhortations, and targets for the work force that ask for zero defects and new levels of productivity.
- Eliminate work standards (quotas) on the factory floor. Substitute leadership.
- Eliminate management by objective. Eliminate management by numbers, numerical goals. Substitute leadership.
- Remove barriers that rob the hourly worker of his right to pride of workmanship. The responsibility of supervisors must be changed from sheer numbers to quality.
- Remove barriers that rob people in management and in engineering of their right to pride in workmanship. This means inter alia, abolishment of the annual or merit rating and of management by objective, management by the numbers.
Institute a vigorous program of education and self-improvement.
Put everybody in the company to work to accomplish the transformation. The transformation is everybody's job.
|
|
|
|
|
Deming's Seven Deadly Diseases |
|
Deming's "Seven Deadly Diseases"
- Lack of constancy of purpose
- Emphasis on short-term profits
- Evaluation by performance, merit rating, or annual review of performance
- Mobility of management
- Running a company on visible figures alone
- Excessive medical costs
- Excessive costs of warranty, fueled by lawyers who work for contingency fees
"A Lesser Category of Obstacles" includes
- Neglecting long-range planning
- Relying on technology to solve problems
- Seeking examples to follow rather than developing solutions
- Excuses, such as "our problems are different"
- Obsolescence in school that management skill can be taught in classes
- Reliance on quality control departments rather than management, supervisors, managers of purchasing, and production workers
- Placing blame on workforces who are only responsible for 15% of mistakes where the system desired by management is responsible for 85% of the unintended consequences
- Relying on quality inspection rather than improving product quality
|
|
|
|
|
Descriptive Statistics |
|
These are numbers that are used to consolodate a large amount of information. Any average, for example, is a descriptive statistic. So, batting averages, average daily rainfall, or average daily temperature are good examples of descriptive statistics. |
|
|
|
|
Diversion |
|
The practice of a hospital asking ambulances to take patients to other hospitals, unless the patient would be put in jeopardy by the delay, because of overcrowding in the emergency department. |
| Source: Mark Graban, Lean Hospitals, Improving Quality, Patient Safety, Employee Satisfaction, Ortho-Clinical Diagnostics, Inc. 2009, p. 244.
|
|
|
|
Dock To Dock |
|
A lean performance measurement counting amounts of in-process inventory (WIP) and converting it to days of inventory between receiving raw material and shipping the finished product (a measurement of product velocity). |
|
|
|
|
Drum-Buffer-Rope |
|
Drum-Buffer-Rope is a manufacturing execution methodology, named for its three components.
- Drum: The physical constraint of the plant: the work center or machine or operation that limits the ability of the entire system to produce more. The rest of the plant follows the beat of the drum. They make sure the drum has work and that anything the drum has processed does not get wasted.
- Buffer: Protects the drum, so that it always has work flowing to it. Buffers in DBR have time as their unit of measure, rather than quantity of material. This makes the priority system operate strictly based on the time an order is expected to be at the drum. Traditional DBR usually calls for buffers at several points in the system: the constraint, synchronization points and at shipping.
- Rope: The work release mechanism for the plant. Orders are released to the shop floor at one "buffer time" before they are due. In other words, if the buffer is 5 days, the order is released 5 days before it is due at the constraint. Putting work into the system earlier than this buffer time is likely to generate too-high work-in-process and slow down the entire system.
|
| Source: "Theory of Constraints" Wikipedia http://en.wikipedia.org. Web. 04 October 2011.
http://en.wikipedia.org/wiki/Theory_of_Constraints
|
|
|
|
Environment |
|
Surroundings in which an organization operates, including air, water, land, natural resources, flora, fauna, humans, and their interrelation.
NOTE: Surroundings in this context extend from within an organization to the global system. |
| Source: ASQ. ISO 14001:2000 - Environmental Management Systems - Requirements With Guidance For Use. Milwaukee, WI: Quality Press, 15 Nov. 2004. PDF.
|
|
|
|
Environmental Aspect |
|
Element of an organization's activities or products or services that can interact with the environment.
NOTE: A significant environmental aspect has or can have a significant environmental impact. |
| Source: ASQ. ISO 14001:2000 - Environmental Management Systems - Requirements With Guidance For Use. Milwaukee, WI: Quality Press, 15 Nov. 2004. PDF.
|
|
|
|
Environmental Impact |
|
Any change to the environment whether adverse or beneficial, wholly or partially resulting from an organization's environmental aspects. |
| Source: ASQ. ISO 14001:2000 - Environmental Management Systems - Requirements With Guidance For Use. Milwaukee, WI: Quality Press, 15 Nov. 2004. PDF.
|
|
|
|
Environmental Management System |
|
Part of an organization's management system used to develop and implement its environmental policy and manage its environmental aspects.
NOTE 1: A managment system is a set of interrelated elements used to establish policy and objectives and to acheive those objectives.
NOTE 2: A managment system includes organizational structure, planning activities, responsibilities, practices, procedures, processes and resources. |
| Source: ASQ. ISO 14001:2000 - Environmental Management Systems - Requirements With Guidance For Use. Milwaukee, WI: Quality Press, 15 Nov. 2004. PDF.
|
|
|
|
Environmental Objective |
|
Overall environmental goal, consistent with the environmental policy, that an organization sets itself to achieve. |
| Source: ASQ. ISO 14001:2000 - Environmental Management Systems - Requirements With Guidance For Use. Milwaukee, WI: Quality Press, 15 Nov. 2004. PDF.
|
|
|
|
Environmental Performance |
|
Measurable results of an organization's managment of its environmental aspects.
NOTE: In the context of Environmental Management System, results can be measured against the organization's environmental policy, environmental objectives, environmental targets and other environmental performance requirements. |
| Source: ASQ. ISO 14001:2000 - Environmental Management Systems - Requirements With Guidance For Use. Milwaukee, WI: Quality Press, 15 Nov. 2004. PDF.
|
|
|
|
Environmental Policy |
|
Overall intentions and direction of an organization related to its environmental performance as formally expressed by top management.
NOTE: The environmental policy provides a framework for actiona and for the setting of environmental objectives and environmental targets. |
| Source: ASQ. ISO 14001:2000 - Environmental Management Systems - Requirements With Guidance For Use. Milwaukee, WI: Quality Press, 15 Nov. 2004. PDF.
|
|
|
|
Environmental Target |
|
Detailed performance requirement, applicable to the organization or parts therof, that arises from the environmental objectives and that needs to be set and met in order to achieve those objectives. |
| Source: ASQ. ISO 14001:2000 - Environmental Management Systems - Requirements With Guidance For Use. Milwaukee, WI: Quality Press, 15 Nov. 2004. PDF.
|
|
|
|
EPE |
|
Stands for Every Part Every ___________. This is a measure of production batch size. Example, if the process is changed over every three (3) days then the EPE is 3 days worth of parts. |
|
|
|
|
Fauna |
|
- The animals of a given region or period considered as a whole.
- A treatise on the animals of a given region or period.
|
| Source: "Flora." Def. All. Dictionary.com. Web. 23 Nov. 2010.
http://dictionary.reference.com/browse/fauna
|
|
|
|
First In First Out |
|
First In First Out, FIFO lanes can be used between two (2) decoupled processes to substitute for a super market, and maintained by flow between them. |
|
|
|
|
First Time Through |
|
First Time Through. A lean performance measurement, the actual percentage (%) loss of raw material as it proceeds through the manufacturing process. This includes all loss, such as nonconforming product, scrap, setup pieces, lab tests, etc. |
|
|
|
|
Fishbone Diagram |
|
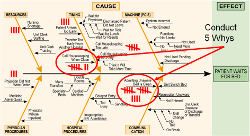 A Fishbone Diagram, often called an Ishikawa Diagram or Cause and Effect Diagram, shows relationships between events. The diagram is useful as a cause-and-effect analysis to help in generating ideas, and in identifying the root cause of a problem for investigation. The Fishbone Diagram, named because it somewhat resembles the skeleton of a fish, provides a graphic display of the relationship between items.
This technique helps users reach a common understanding of the problem, and is constructed after the probelm is identified. A Fishbone Diagram consists of a central "spine" with a fish's head (the box containing the main activity under discussion) on the right side. There are a number diagonal ribs coming from the spine. At the end of each rib is a short horizontal box containing the major process steps.
The major process categories are recorded in the horizontal boxes at the end of the ribs. The causes of these categories (subideas) arfe recorded as short spines off the ribs. |
| Source: Peter Mears, Quality Improvement - Tools & Techniques, McGraw-Hill, Inc. 1995, p. 52.
|
|
|
|
Five Focusing Steps |
|
Theory of Constraints is based on the premise that the rate of goal achievement is limited by at least one constraining process. Only by increasing flow through the constraint can overall throughput be increased.
Assuming the goal of the organization has been articulated (e.g., "Make money now and in the future") the steps are:
- Identify the constraint (the resource or policy that prevents the organization from obtaining more of the goal)
- Decide how to exploit the constraint (get the most capacity out of the constrained process)
- Subordinate all other processes to above decision (align the whole system or organization to support the decision made above)
- Elevate the constraint (make other major changes needed to break the constraint)
- If, as a result of these steps, the constraint has moved, return to Step 1. Don't let inertia become the constraint.
The five focusing steps aim to ensure ongoing improvement efforts are centered around the organization's constraints. In the TOC literature, this is referred to as the "Process of Ongoing Improvement" (POOGI).
|
| Source: "Theory of Constraints" Wikipedia http://en.wikipedia.org. Web. 04 October 2011.
http://en.wikipedia.org/wiki/Theory_of_Constraints
|
|
|
|
Flora |
|
- The plants of a particular region or period, listed by species and considered as a whole.
- A work systematically describing such plants.
- Plants, as distinguished from fauna.
- The aggregate of bacteria, fungi, and other microorganisms normally occurring on or in the bodies of humans and other animals: intestinal flora.
|
| Source: "Flora." Def. All. Dictionary.com. Web. 23 Nov. 2010.
http://dictionary.reference.com/browse/flora
|
|
|
|
Flow |
|
The uninterrupted march of product being manufactured. |
|
|
|
|
Flow Chart |
|
A flowchart is a type of diagram that represents an algorithm or process, showing the steps as boxes of various kinds, and their order by connecting these with arrows. This diagrammatic representation can give a step-by-step solution to a given problem. Process operations are represented in these boxes, and arrows connecting them represent flow of control.
Flowcharts are used in designing and documenting complex processes. Like other types of diagram, they help visualize what is going on and thereby help the viewer to understand a process, and perhaps also find flaws, bottlenecks, and other less-obvious features within it. There are many different types of flowcharts, and each type has its own repertoire of boxes and notational conventions. The two most common types of boxes in a flowchart are:
- a processing step, usually called activity, and denoted as a rectangular box
- a decision, usually denoted as a diamond
A flowchart is described as "cross-functional" when the page is divided into different swimlanes describing the control of different organizational units. A symbol appearing in a particular "lane" is within the control of that organizational unit. This technique allows the author to locate the responsibility for performing an action or making a decision correctly, showing the responsibility of each organizational unit for different parts of a single process.
The first structured method for documenting process flow, the "flow process chart", was introduced by Frank Gilbreth to members of the American Society of Mechanical Engineers (ASME) in 1921 in the presentation "Process ChartsFirst Steps in Finding the One Best Way". |
| Source: "Flow Chart" Wikipedia http://en.wikipedia.org. Web. 28 July 2011.
http://en.wikipedia.org/wiki/Flow_chart
|
|
|
|
Flow Kaizen |
|
Value stream improvements. |
|
|
|
|
Folding (in DOE) |
|
Folding is a way to reduce confounding. Confounding occurs when you have a fractional factorial design and one or more effects cannot be estimated separately. The effects that cannot be separated are said to be aliased. When you fold on all factors, Minitab adds four runs to the design and reverses the signs of each factor in the additional runs. When you fold on one factor, Minitab adds four runs to the design, but only reverses the signs of the specified factor. The signs of the remaining factors stay the same. These rows are then appended to the end of the data matrix. |
|
|
|
|
Force Field Analysis |
|
Force Field Analysis is a technique developed by Kurk Lewin for identifying the forces that are present in a situation. Once the driving and restraining forces are understood, then plans can be developed for implementing change. |
| Source: Peter Mears, Quality Improvement - Tools & Techniques, McGraw-Hill, Inc. 1995, p. 140.
|
|
|
|
Future Reality Tree |
|
A logic-based tool used to construct and test potential solutions prior to implementation. The objectives are to: 1) develop, expand, and complete the solution and 2) identify and solve existing problems while preventing new problems from being created by implementation of the solution(s). |
| Source: "Future Reality Tree" Pinnacle Strategies http://www.pinnacle-strategies.com. Web. 04 October 2011.
http://www.pinnacle-strategies.com/Theory%20of%20Constraints%20glossary.htm#f
|
|
|
|
Gage |
|
Any device used to obtain measurements; frequently used to refer specificallly to the devices used on the shop floor; includes go/no-go devices. |
| Source: DaimlerChrysler Corporation/Ford Motor Company/General Motors Corporation Supplier Quality Requirements Task Force. Measurement Systems Analysis - Reference Manual (Third Edition). Southfield, MI: AIAG, March 2002, p. 5.
|
|
|
|
Gage Repeatability and Reproducibility |
|
An estimate of the combined variation of repeatability and reproducibility for a measurement system. The GRR variance is equal to the sum of within-system and between-system variances. |
| Source: DaimlerChrysler Corporation/Ford Motor Company/General Motors Corporation Supplier Quality Requirements Task Force. Measurement Systems Analysis - Reference Manual (Third Edition). Southfield, MI: AIAG, March 2002, p. 206.
|
|
|
|
Gemba |
|
The Japanese word for "the place where work is done" (factory floor). |
|
|
|
|
Gembutsu |
|
Japanese word for the actual machine or product. |
|
|
|
|
Genchi Genbutsu |
|
A Japanese phrase that means "go and see." |
|
|
|
|
Genjitsu |
|
The Japanese word for the actual facts supported by data. |
|
|
|
|
Hansei |
|
Relentless reflection in order to acknowledge your own mistake and to pledge improvement. |
|
|
|
|
Heijunka |
|
A Japanese term meaning Production Leveling or Production Smoothing. It is a technique for reducing the muda waste and vital to the development of production efficiency in the Toyota Production System and Lean Manufacturing. |
|
|
|
|
Histogram |
|
In statistics, a histogram is a graphical representation, showing a visual impression of the distribution of data. It is an estimate of the probability distribution of a continuous variable and was first introduced by Karl Pearson. A histogram consists of tabular frequencies, shown as adjacent rectangles, erected over discrete intervals (bins), with an area equal to the frequency of the observations in the interval. The height of a rectangle is also equal to the frequency density of the interval, i.e., the frequency divided by the width of the interval. The total area of the histogram is equal to the number of data. A histogram may also be normalized displaying relative frequencies. It then shows the proportion of cases that fall into each of several categories, with the total area equaling 1. The categories are usually specified as consecutive, non-overlapping intervals of a variable. The categories (intervals) must be adjacent, and often are chosen to be of the same size.
Histograms are used to plot density of data, and often for density estimation: estimating the probability density function of the underlying variable. The total area of a histogram used for probability density is always normalized to 1. If the length of the intervals on the x-axis are all 1, then a histogram is identical to a relative frequency plot.
|
| Source: "Histogram" Wikipedia http://en.wikipedia.org. Web. 28 July 2011.
http://en.wikipedia.org/wiki/Histogram
|
|
|
|
Hoshin Kanri |
|
A Japanese term meaning policy deployment or strategic planning. |
|
|
|
|
Implantable Medical Device |
|
Medical device intended:
- to be totally or partially introduced into the human body or a natural orifice, or
- to replace an epithelial surface or the surface of the eye,
by surgical intervention, and which is intended to remain after the procedure for at least 30 days, and which can only be removed by medical or surgical intervention.
NOTE: This definition applies to implantable medical devices other than active implantable medical devices. |
| Source: ISO. ISO 13485:2003 - Medical devices Quality management
systems Requirements for regulatory purposes. Genevea, Switzerland: ISO, 15 July 2003. PDF.
|
|
|
|
Inferential Statistics |
|
Inferential statistics are used when we want to draw conclusions. For example when we want to determine if some treatment is better than another, or if there are differences in how two groups perform. A good book definition is using samples to draw inferences about populations. |
|
|
|
|
International Organization for Standardization |
|
ISO (International Organization for Standardization) is the world's largest developer and publisher of International Standards.
ISO is a network of the national standards institutes of 162 countries, one member per country, with a Central Secretariat in Geneva, Switzerland, that coordinates the system.
ISO is a non-governmental organization that forms a bridge between the public and private sectors. On the one hand, many of its member institutes are part of the governmental structure of their countries, or are mandated by their government. On the other hand, other members have their roots uniquely in the private sector, having been set up by national partnerships of industry associations.
Therefore, ISO enables a consensus to be reached on solutions that meet both the requirements of business and the broader needs of society.
ISO's Name
Because "International Organization for Standardization" would have different acronyms in different languages ("IOS" in English, "OIN" in French for Organisation internationale de normalisation), its founders decided to give it also a short, all-purpose name. They chose "ISO", derived from the Greek isos, meaning "equal". Whatever the country, whatever the language, the short form of the organization's name is always ISO. |
| Source: http://www.iso.org/iso/about.htm
http://www.iso.org/iso/about/discover-iso_isos-name.htm
|
|
|
|
Jidoka |
|
A Japanese word meaning "intelligent automation" or "automation with a human touch". |
|
|
|
|
Job Instruction Training |
|
One of the four programs that make up Training Within Industry. Trains workers in how to instruct a person to perform a job correctly and safely; and to be productive as quickly as possible, while creating less scrap, rework, and damage to tools and equipment. |
| Source: Donald A. Dinero, Training Within Industry, The foundation of Lean, Productivity Press 2005, p. 3.
|
|
|
|
Job Methods Training |
|
One of the four programs that make up Training Within Industry. Trains employees in how to improve the way jobs are performed in order to consistently produce greater quantities of quality products in less time using the available manpower, machines, and materials. |
| Source: Donald A. Dinero, Training Within Industry, The foundation of Lean, Productivity Press 2005, p. 4.
|
|
|
|
Job Relations Trainng |
|
One of the four programs that make up Training Within Industry. Trains employees in how to solve personal problems using an analytical, nonemotional method combined with some basic foundations of human relations. JR emphasizes that you must treat all people as individuals and be understanding people on all levels, supervisors can achieve results working through people. |
| Source: Donald A. Dinero, Training Within Industry, The foundation of Lean, Productivity Press 2005, p. 3.
|
|
|
|
Juran Trilogy |
|
Juran defined three managerial processes that are necessary to manage for quality, called the Juran Trilogy:
| Quality Planning |
Quality Control |
Quality Improvement |
- Establish quality goals
- Identify who the customers are
- Determine the needs of the customers
- Develop product features that respond to customer needs
- Develop processes able to produce the product features
- Establish process controls; transfer the plans to the operating for
|
- Evaluate actual performance
- Compare actual performance with quality goals
- Act on the difference
|
- Prove the need
- Establish the infrastructure
- Identify the improvement projects
- Establish project teams
- Provide the teams with resources, training and motivation to:
- Diagnose the causes
- Stimulate remedies
- Establish controls to hold the gains
|
|
|
|
|
|
Just-In-Time |
|
Just-In-Time manufacturing is a philosophy that says we use inventory and manufacture items as they are needed or just-in-time. Holding inventories is wrong and producing long manufacturing runs and storing items in finished goods inventory is wasteful, and prevents firms from adopting to changing customer needs. |
| Source: Peter Mears, Quality Improvement - Tools & Techniques, McGraw-Hill, Inc. 1995, p. 210.
|
|
|
|
Kaikaku |
|
The Japanese word for rapid improvements. |
|
|
|
|
Kaizen |
|
A Japanese word meaning incremental and continuous improvement. |
|
|
|
|
Kanban |
|
A card containing all of the information required to be done on a product at each stage along its path to completion. Kanbans are used in a "Just In Time" system to pull product through production rather than the push system as is found in a production release. |
|
|
|
|
Kata |
|
A Japanese word describing detailed choreographed patterns of movements practised either solo or in pairs. At Toyota, it refers to their unique improvement and leadership routines. |
|
|
|
|
Lead Time (L/T) |
|
The time it takes one piece to move all the way through a process or a value stream from start to finish. Envision timing a marked part as it moves from beginning to end. For the VS Map, calculate lead times by: INVENTORY QUANTITY divided by THE DAILY CUSTOMER REQUIREMENT. A common rule of thumb is 240 workdays per year or 20 workdays per month. |
|
|
|
|
Learning Organization |
|
There is a multitude of definitions of a learning organization as well as their typologies. According to Peter Senge, a learning organization exhibits five main characteristics: systems thinking, personal mastery, mental models, a shared vision, and team learning.
Systems Thinking
The idea of the learning organization developed from a body of work called systems thinking. This is a conceptual framework that allows people to study businesses as bounded objects. Learning organizations use this method of thinking when assessing their company and have information systems that measure the performance of the organization as a whole and of its various components. Systems thinking states that all the characteristics must be apparent at once in an organization for it to be a learning organization. If some of these characteristics is missing then the organization will fall short of its goal. However OKeeffe believes that the characteristics of a learning organization are factors that are gradually acquired, rather than developed simultaneously.
Personal Mastery
The commitment by an individual to the process of learning is known as personal mastery. There is a competitive advantage for an organization whose workforce can learn more quickly than the workforce of other organizations. Individual learning is acquired through staff training and development, however learning cannot be forced upon an individual who is not receptive to learning. Research shows that most learning in the workplace is incidental, rather than the product of formal training, therefore it is important to develop a culture where personal mastery is practiced in daily life. A learning organization has been described as the sum of individual learning, but there must be mechanisms for individual learning to be transferred into organizational learning.
Mental Models
The assumptions held by individuals and organizations are called mental models. To become a learning organization, these models must be challenged. Individuals tend to espouse theories, which are what they intend to follow, and theories-in-use, which are what they actually do. Similarly, organisations tend to have memories which preserve certain behaviours, norms and values. In creating a learning environment it is important to replace confrontational attitudes with an open culture that promotes inquiry and trust. To achieve this, the learning organization needs mechanisms for locating and assessing organizational theories of action. Unwanted values need to be discarded in a process called unlearning. Wang and Ahmed refer to this as triple loop learning.
Shared Vision
The development of a shared vision is important in motivating the staff to learn, as it creates a common identity that provides focus and energy for learning. The most successful visions build on the individual visions of the employees at all levels of the organization, thus the creation of a shared vision can be hindered by traditional structures where the company vision is imposed from above. Therefore, learning organizations tend to have flat, decentralized organizational structures. The shared vision is often to succeed against a competitor, however Senge states that these are transitory goals and suggests that there should also be long term goals that are intrinsic within the company.
Team Learning
The accumulation of individual learning constitutes Team learning. The benefit of team or shared learning is that staff grow more quickly and the problem solving capacity of the organization is improved through better access to knowledge and expertise. Learning organizations have structures that facilitate team learning with features such as boundary crossing and openness. Team learning requires individuals to engage in dialogue and discussion; therefore team members must develop open communication, shared meaning, and shared understanding. Learning organizations typically have excellent knowledge management structures, allowing creation, acquisition, dissemination, and implementation of this knowledge in the organization. |
| Source: "Learning organization" Wikipedia http://en.wikipedia.org. Web. 11 January 2012.
http://en.wikipedia.org/wiki/Learning_organization
|
|
|
|
Leveling The Production Mix |
|
Distributing the production of different product evenly over a time period. Instead of assembling all the "type A" parts in the morning and all the "type B" parts in the afternoon, leveling means alternating repeatedly between smaller batches of A and B. The more you level the production mix at the pacemaker the more you will be able to respond to customer requirements with a short lead time while holding little finished goods inventory, |
|
|
|
|
Likert Scale |
|
Likert Scales are used in developing questionnaires to measure attitudes and perceptions. By interpreting answers to Likert Scale questions, an understanding can be gained regarding consumers' feelings about the quality of goods and services. A seve-point Likert Scale structure is shown. This can be abbreviated to a five-point scale if desired.
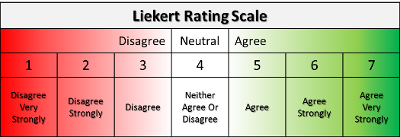
Before developing the actual questions to be asked, define the objective of the study, which should closely match the problem statement. Then, precisely define the consumer you are concerned with. Keep the survey's objective and the consumer in mind when developing specific survey questions. |
| Source: Peter Mears, Quality Improvement - Tools & Techniques, McGraw-Hill, Inc. 1995, p. 108.
|
|
|
|
Linearity |
|
The difference in bias errors over the expected operating range of the measurement system. In other terms, linearity expresses the correlation of multiple and independent bias errors over the operating range. |
| Source: DaimlerChrysler Corporation/Ford Motor Company/General Motors Corporation Supplier Quality Requirements Task Force. Measurement Systems Analysis - Reference Manual (Third Edition). Southfield, MI: AIAG, March 2002, p. 207.
|
|
|
|
Load Leveling Box (Heijunka) |
|
used for paced withdrawal of small, consistent quantities of work. A tool to help level both the mix and volume of production. It contains a column of Kanban slots for each production type. This is important because a prerequisite for lean manufacturing is that both the mix and volume of production be leveled. |
|
|
|
|
Malcolm Baldrige National Quality Award |
|
A U.S. national quality award sponsored by the U.S. Department of Commerce and private industry. The award is named after former Secretary of Commerce Malcolm Baldrige. |
|
|
|
|
Measure, Analyze, Improve, Control |
|
Measure, Analyze, Improve, Control. This is the steps of Six Sigma. |
|
|
|
|
Measurement |
|
Measurement is defined as "the assignment of numbers [or values] to material things to represent the relations among them with respect to particular properties." This definintion was first given by C. Eisenhart (1963). The process of assigning the numbers is defined as the measurement process, and the value assigned is defined as the measurement value. |
| Source: DaimlerChrysler Corporation/Ford Motor Company/General Motors Corporation Supplier Quality Requirements Task Force. Measurement Systems Analysis - Reference Manual (Third Edition). Southfield, MI: AIAG, March 2002, p. 4.
|
|
|
|
Measurement System |
|
Measurement System is the collection of instruments or gages, standards, operations, mehtods, fixtures, software, personnel, environment and assumptions used to quantify a unit of measure or fix assessment to the feature characteristic being measured; the complete process used to obtain measurements. |
| Source: DaimlerChrysler Corporation/Ford Motor Company/General Motors Corporation Supplier Quality Requirements Task Force. Measurement Systems Analysis - Reference Manual (Third Edition). Southfield, MI: AIAG, March 2002, p. 5.
|
|
|
|
Measurement System Analysis |
|
Measurement System Analysis (MSA) is a specially designed experiment that seeks to identify the components of variation in the measurement.
A Measurement Systems Analysis evaluates the test method, measuring instruments, and the entire process of obtaining measurements to ensure the integrity of data used for analysis (usually quality analysis) and to understand the implications of measurement error for decisions made about a product or process.
A Measurement Systems Analysis considers the following:
- Selecting the correct measurement and approach
- Assessing the measuring device
- Assessing procedures & operators
- Assessing any measurement interactions
- Calculating the measurement uncertainty of individual measurement devices and/or measurement systems
|
| Source: "Measurement system analysis" Wikipedia http://en.wikipedia.org. Web. 04 October 2011.
http://en.wikipedia.org/wiki/Measurement_systems_analysis
|
|
|
|
Medical Device |
|
Any instrument, apparatus, implement, machine, appliance, implant, in vitro reagent or calibrator, software,material or other similar or related article, intended by the manufacturer to be used, alone or in combination, for human beings for one or more of the specific purpose(s) of:
- diagnosis, prevention, monitoring, treatment or alleviation of disease,
- diagnosis, monitoring, treatment, alleviation of or compensation for an injury,
- investigation, replacement, modification, or support of the anatomy or of a physiological process,
- supporting or sustaining life,
- control of conception,
- disinfection of medical devices,
- providing information for medical purposes by means of in vitro examination of specimens derived from the human body,
and which does not achieve its primary intended action in or on the human body by pharmacological, immunological or metabolic means, but which may be assisted in its function by such means.
NOTE: This definition has been developed by the Global Harmonization Task Force (GHTF). |
| Source: ISO. ISO 13485:2003 - Medical devices Quality management
systems Requirements for regulatory purposes. Genevea, Switzerland: ISO, 15 July 2003. PDF.
|
|
|
|
Milk Run |
|
Routing a delivery vehicle in a way that allows it to make pickups or drop-offs at multiple locations on a single travel loop, as opposed to making separate trips to each location. |
|
|
|
|
Monument |
|
A process step or machine that will not cooperate with flow, therefore requiring batch and queue processing. |
|
|
|
|
Muda |
|
Muda is a traditional Japanese term for an activity that is wasteful and doesn't add value or is unproductive. |
|
|
|
|
Multi-Vari |
|
A collection of statistical methods used to pinpoint the source of variation. |
|
|
|
|
Mura |
|
Mura is a general Japanese term for unevenness, inconsistency in physical matter or human spiritual condition. |
|
|
|
|
Muri |
|
Muri is a Japanese term for strain, overburden, unreasonableness or absurdity. |
|
|
|
|
Nemawashi |
|
The process of discussing problems and potential solutions with all of those affected, to collect their ideas and get agreement on a path forward. This consensus process, though time-consuming, helps broaden the search for solutions, and once a decision is made, the stage is set for rapid implementation. |
|
|
|
|
Noise Factor (Regarding DOE) |
|
Factors that you can not easily control in the manufacture or use of a product. In the experimental setting, you do control the levels of noise factors to simulate the sources of variation the product will be subjected to in actual use. The goal of robust parameter design is to find levels of the control factors that will minimize the sensitivity of the product to changes in the noise factors. |
|
|
|
|
Onboarding |
|
Refers to the mechanism through which new employees acquire the necessary knowledge, skills, and behaviors to become effective organizational members and insiders. |
| Source: "Onboarding" Wikipedia http://en.wikipedia.org. Web. 07 January 2013.
http://en.wikipedia.org/wiki/Onboarding
|
|
|
|
Overall Equipment Effectiveness |
|
Overall Equipment Effectiveness. A lean performance metric organized to measure machine up time and decompose reasons for down time. Measured in percentage (%), with 85% being considered "World Class Performance". |
|
|
|
|
Pacemaker |
|
When using a supermarket pull system, you typically need to schedule only one point in the door-to-door value stream. This point is called the pacemaker process because how you control production at this process sets the pace for all downstream processes. No further pull should occur downstream from the pacemaker, the process must flow. |
|
|
|
|
Pareto Chart |
|
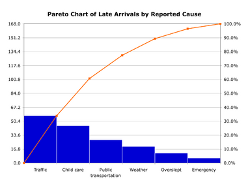 A Pareto Chart, named after Vilfredo Pareto, is a type of chart that contains both bars and a line graph, where individual values are represented in descending order by bars, and the cumulative total is represented by the line.
The left vertical axis is the frequency of occurrence, but it can alternatively represent cost or another important unit of measure. The right vertical axis is the cumulative percentage of the total number of occurrences, total cost, or total of the particular unit of measure. Because the reasons are in decreasing order, the cumulative function is a concave function. To take the example above, in order to lower the amount of late arriving by 80%, it is sufficient to solve the first three issues.
The purpose of the Pareto chart is to highlight the most important among a (typically large) set of factors. In quality control, it often represents the most common sources of defects, the highest occurring type of defect, or the most frequent reasons for customer complaints, and so on. Wilkinson (2006) devised an algorithm for producing statistically-based acceptance limits (similar to confidence intervals) for each bar in the Pareto chart.
The attached graphic diplays a simple example of a Pareto chart using hypothetical data showing the relative frequency of reasons for arriving late at work.
|
| Source: "Pareto Chart" Wikipedia http://en.wikipedia.org. Web. 28 July 2011.
http://en.wikipedia.org/wiki/Pareto_chart
|
|
|
|
Parking Lot |
|
A term used in meetings that refers to a flip-chart or whiteboard where topics that are off-the-subject are "parked" with the agreement that these topics will be candidates for the agenda in a future meeting. |
|
|
|
|
Phlebotomist |
|
A hosptial employee who draws and collects patient blood specimens. |
| Source: Mark Graban, Lean Hospitals, Improving Quality, Patient Safety, Employee Satisfaction, Ortho-Clinical Diagnostics, Inc. 2009, p. 241.
|
|
|
|
Pitch Quantity |
|
A consistent increment of work based on a packout container quantity (the number of parts one finished goods container holds), or a multiple or fraction of that quantity. Pitch equals takt time (in seconds) times the pack size. |
|
|
|
|
Plan Do Check Act |
|
The Plan-Do-Check-Act (PDCA) is a well-known model for continual process improvement. It teaches organizations to Plan an action, Do it, Check to see how it conforms to the plan and Act on what has been learned.
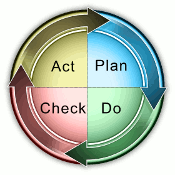 The PDCA Cycle consists of the following four steps: The PDCA Cycle consists of the following four steps:
- Plan: Recognize an opportunity and plan the change.
- Do: Test the change.
- Check: Review the test, analyze the results and identify what was learned.
- Act: Take action based on what was learned in the check step. If the change was successful, incorporate what was learned from the test into wider changes. If not, go through the cycle again with a different plan.
 The PDCA Cycle is also know as the Shewhart Cycle and Deming Cycle. Walter A. Shewhart first discussed the concept of PDCA in his 1939 book, Statistical Method From the Viewpoint of Quality Control. The PDCA Cycle is also know as the Shewhart Cycle and Deming Cycle. Walter A. Shewhart first discussed the concept of PDCA in his 1939 book, Statistical Method From the Viewpoint of Quality Control.
W. Edwards Deming is credited with encouraging the Japanese in the 1950s to adopt PDCA. The Japanese eagerly embraced PDCA and to honor Deming for his instruction, they refer to the PDCA Cycle as the Deming Cycle. |
|
|
|
|
Poka Yoke |
|
A Japanese term that means 'mistake proofing'. |
|
|
|
|
Process Capacity |
|
Available work time divided by cycle time multiplied by up time percentage is a measure of current process capacity, if no changeovers are made. |
|
|
|
|
Process Improvement Event |
|
In healthcare, another name for a Kaizen Event. |
| Source: Mark Graban, Lean Hospitals, Improving Quality, Patient Safety, Employee Satisfaction, Ortho-Clinical Diagnostics, Inc. 2009, p. 207.
|
|
|
|
Process Kaizen |
|
Elimination of waste. |
|
|
|
|
Product Family |
|
A group of products that pass through similar processing steps and over common equipment. |
|
|
|
|
Program Development |
|
One of the four programs that make up Training Within Industry. Trains employees to solve production problems that were unique to their organization. PD solves problems related to personnel through training while problems related to other resources are solved through technical means. |
| Source: Donald A. Dinero, Training Within Industry, The foundation of Lean, Productivity Press 2005, p. 4.
|
|
|
|
Pull |
|
To qualify as pull parts must not be produced or conveyed if there is no Kanban. |
|
|
|
|
Push |
|
The process makes something regardless of the actual needs of the downstream customer process and pushes it ahead. The hallmark of push is producing to a schedule. |
|
|
|
|
Quality Function Deployment |
|
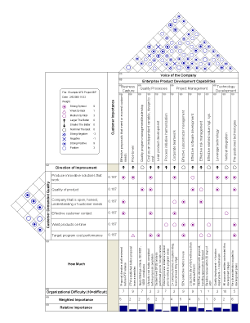 Quality Function Deployment (QFD) is an advanced form of customer needs mapping which encourages users to focus on the broader process of how results are obtained. QFD was developed by the Japanese in 1972. It is a formal process for translating customer requirements into appropriate technical requirements. QFD is used to assure that all of a company's operations are driven by the customer's needs, rather than by top management (or by design engineers). Quality Function Deployment (QFD) is an advanced form of customer needs mapping which encourages users to focus on the broader process of how results are obtained. QFD was developed by the Japanese in 1972. It is a formal process for translating customer requirements into appropriate technical requirements. QFD is used to assure that all of a company's operations are driven by the customer's needs, rather than by top management (or by design engineers).
The attached image represents an example of a QFD House of Quality matrix. |
| Source: Peter Mears, Quality Improvement - Tools & Techniques, McGraw-Hill, Inc. 1995, p. 165.
|
|
|
|
Radar Chart |
|
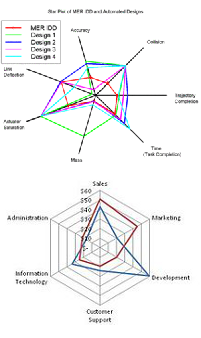 A Radar Chart is a combination of a circle and line graph that is used to portray relative strenghts (or weaknesses) of activities. These charts are particularly useful in showing changes from period to period for items measured on a Likert scale.
The first chart is an example of a Star Plot and the second chart is an example of a Spider Chart. |
| Source: Peter Mears, Quality Improvement - Tools & Techniques, McGraw-Hill, Inc. 1995, p. 109.
|
|
|
|
Rapid Process Improvement Workshop |
|
In healthcare, another name for a Kaizen Event. |
| Source: Mark Graban, Lean Hospitals, Improving Quality, Patient Safety, Employee Satisfaction, Ortho-Clinical Diagnostics, Inc. 2009, p. 207.
|
|
|
|
Reactive Customer-Driven Quality |
|
A state that is characterized by a supplier "reacting" to the quality expectations of a customer rather than proactively anticipating customer needs and expectations. |
|
|
|
|
Repeatability |
|
The common cause, random variation resulting from successive trials under defined conditions of measurment. Often referred to as equipment variation (EV), although this is misleading. The best term for repeatability is within-system variation when the conditions of measurement are fixed and defined - fixed part, instrument, standard, method, operator, environment and assumptions. In addition to within-equipment variation, repeatability will include all within variation from the conditions in the measurement error model. |
| Source: DaimlerChrysler Corporation/Ford Motor Company/General Motors Corporation Supplier Quality Requirements Task Force. Measurement Systems Analysis - Reference Manual (Third Edition). Southfield, MI: AIAG, March 2002, p. 208.
|
|
|
|
Repetition |
|
Doing a DOE this is running several samples during one experimental trial. |
|
|
|
|
Replication |
|
Replicate the entire experiment, in the same sequence during a DOE. |
|
|
|
|
Reproducibility |
|
The variation in the average of measurements caused by a normal condition(s) of change in the measurment process. Typically, it has been defined as the variation in average measurements of the same part between different appraisers using the same measuring instrument and method in a stable environment. This is often true for manual instruments influenced by the skill of the operator. It is not true, however, for measurement processes (i.e. automated systems) where the operator is not a major source of variation. For this reason, reproducibility is referred to as the average variation between-systems or between-conditions of measurement. |
| Source: DaimlerChrysler Corporation/Ford Motor Company/General Motors Corporation Supplier Quality Requirements Task Force. Measurement Systems Analysis - Reference Manual (Third Edition). Southfield, MI: AIAG, March 2002, p. 209.
|
|
|
|
Resolution |
|
Regarding the DOE process resolution is the power of a fractional design to distinguish main effects from generally confounded interactions. Resolution II & III designs are weak with main effects and interactions confounded, the higher resolutions are better with less confounding. |
|
|
|
|
Reverse Engineering |
|
The process of dismantling a competitor's products to understand the strengths and weaknesses of the designs. |
|
|
|
|
Run Chart |
|
A Run Chart (often called a line graph or trend chart) is used to display output of a process over time. Errors per time period, machine downtime, and productivity are commonly displayed. The main point of any chart or graph is to "make your point" at a glance. Because Run Charts have a powerful visual impact, they are frequently used as a quality indicator to support a Continuous Quality Improvement (CQI) Story. |
| Source: Peter Mears, Quality Improvement - Tools & Techniques, McGraw-Hill, Inc. 1995, p. 61.
|
|
|
|
Scatter Diagram |
|
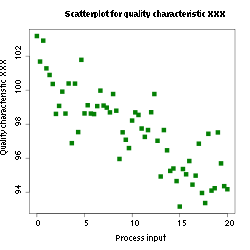 A Scatter Diagram shows the relationship between two variables; typically a cause and effect condition. Scatter Diagrams are used to visually gauage how the change in one variable effects another. As such they are useful in developing problem solutions. A Scatter Diagram shows the relationship between two variables; typically a cause and effect condition. Scatter Diagrams are used to visually gauage how the change in one variable effects another. As such they are useful in developing problem solutions. |
| Source: Peter Mears, Quality Improvement - Tools & Techniques, McGraw-Hill, Inc. 1995, p. 57.
|
|
|
|
Sensei |
|
The Japanese term for "teacher." It is used to describe a person with a deep understanding of lean knowledge, which has been acquired through years of experience. |
|
|
|
|
Shojinka |
|
In a Japanese production system, Shojinka means that flexibility has been attained so that the number of workers can be altered to meet changes in production demand. That is, Shojinka meets demand changes through flexibility by increasing or descreasing workers to meet an increase or decrease in demand. Three factors are needed to realize the Shojinka concept:
- A flexible machine layout
- A cross-trained employee
- Continuous improvement of operations
|
| Source: Peter Mears, Quality Improvement - Tools & Techniques, McGraw-Hill, Inc. 1995, p. 209.
|
|
|
|
Six Sigma Methods |
|
The systematic deployment of Define, Measure, Analyze, Improve, Control; for the purposeful dispatch of problems or project completion. |
|
|
|
|
Six Sigma Quality |
|
Making a process so robust that six standard deviations of process variation, allowing a 1.5 shift in the average, will fit between the nearest specification limit and the process average. Statistically this will deliver no more that 3.4 defects per million. |
|
|
|
|
Sterile Medical Device |
|
Category of medical device intended to meet the requirements for sterility.
NOTE: The requirements for sterility of a medical device might be subject to national or regional regulations or standards. |
| Source: ISO. ISO 13485:2003 - Medical devices Quality management
systems Requirements for regulatory purposes. Genevea, Switzerland: ISO, 15 July 2003. PDF.
|
|
|
|
Subject Matter Expert |
|
A person who has intimate knowledge or expertise of a particular area, topic or process. Individuals who are involved in the day to day activities of a process is sometimes referred to as a subject matter expert and a such is asked to participate as part of team charged with improving the process. |
|
|
|
|
Supermarket |
|
A lean remedy for a monument. A buffer containing more than one part number whose size is statistically controlled to support flow to more than one value stream. Frequently a supermarket is stimulated by a Kanban system of pull. |
|
|
|
|
Taguchi Method |
|
An approach to quality management developed by Dr. Genichi Taguchi in 1980. The Taguchi method provides:
- A basis for determining the functional relationship between controllable product or service design factors and the outcomes of a process.
- A method for adjusting the mean of a process by optimizing controllable variables.
- A procedure for examining the relationship between random noise in the process and product or service variability.
|
|
|
|
|
Takt Time |
|
Takt time can be defined as the rate at which a product is produced in order to meet the customer demand. It is derived from the German word Taktzeit which translates to cycle time. Takt time sets the pace for industrial manufacturing lines. In automobile manufacturing, for example, cars are assembled on a line, and are moved on to the next station after a certain time - the takt time. Therefore, the time needed to complete work on each station has to be less than the takt time in order for the product to be completed within the allotted time.
Takt time concept aims to match the pace of production with customer's demand.
Takt time can be first determined with the formula:
Where:
T = Takt time, e.g. [minutes of work / unit produced]
Ta = Net time available to work, e.g. [minutes of work / day]
Td = Time demand (customer demand), e.g. [units required / day]
Net available time is the amount of time available for work to be done. This excludes break times and any expected stoppage time (for example scheduled maintenance, team briefings, etc.).
|
|
|
|
|
Terms (in DOE) |
|
This is a factor or interaction included in the model for analysis. |
|
|
|
|
Theory Of Constraints |
|
Theory of Constraints (TOC) is an overall management philosophy introduced by Dr. Eliyahu M. Goldratt in his 1984 book titled The Goal, that is geared to help organizations continually achieve their goals.[1] Dr. Eliyahu M. Goldratt adopted the concept with his book Critical Chain, published 1997. The concept was extended to TOC with respectively titled publication in 1999.
The title Theory of Constraints (TOC) adopts the common idiom "A chain is no stronger than its weakest link" as a new management paradigm. This means that processes, organisations, etc., are vulnerable because the weakest person or part can always damage or break them or at least adversely affect the outcome.
The analytic approach with TOC comes from the contention that any manageable system is limited in achieving more of its goals by a very small number of constraints, and that there is always at least one constraint. Hence the TOC process seeks to identify the constraint and restructure the rest of the organization around it, through the use of Five Focusing Steps.
|
| Source: "Theory of Constraints" Wikipedia http://en.wikipedia.org. Web. 04 October 2011.
http://en.wikipedia.org/wiki/Theory_of_Constraints
|
|
|
|
Thinking Processes (Theory of Constraints) |
|
The Thinking Processes are a set of tools to help managers walk through the steps of initiating and implementing a project. When used in a logical flow, the Thinking Processes help walk through a buy-in process:
- Gain agreement on the problem
- Gain agreement on the direction for a solution
- Gain agreement that the solution solves the problem
- Agree to overcome any potential negative ramifications
- Agree to overcome any obstacles to implementation
TOC practitioners sometimes refer to these in the negative as working through layers of resistance to a change. |
| Source: "Theory of Constraints" Wikipedia http://en.wikipedia.org. Web. 04 October 2011.
http://en.wikipedia.org/wiki/Theory_of_Constraints
|
|
|
|
Tiger Teams |
|
Teams with a specific defined goal and a short time frame to attain the goal. |
|
|
|
|
Training Within Industry |
|
Also referred to as TWI, it is a program which uses a learn-by-doing approach, teaching essential skills for supervisors and team leaders. Its four core elements are:
- Job Relations
- Job Instruction
- Job Methods
- Program Development
Its roots go back to the Training Within Industry service created by the U.S. Department of War in 1940. |
|
|
|
|
Value |
|
What the customer is willing to pay for. |
|
|
|
|
Value Added Activity |
|
What the customer is willing to pay for as part of the process. |
|
|
|
|
Value Added Time |
|
Time of those work elements that actually transform the product in a way that the customer is willing to pay for. |
|
|
|
|
Voice Of The Business |
|
The Voice Of The Business represents the needs of the business and its key stakeholders. These needs include items like; profitability, revenue, growth, market share, etc. |
|
|
|
|
Voice Of The Customer |
|
A phrase that refers to the range of results that are acceptable to a customer, whether in the form of a numeric specification or verbal feedback. |
|
|
|
|
Voice Of The Process |
|
A phrase that refers to the range of results that are produced by a process. |
|
|
|
|
Warm and Cold Words |
|
There are warm words and cold words just as there are warm and cold colors. Warm words help us feel safe and secure. Cold words create doubt and unease. Cold words have their place but use them with care.
| WARM WORDS |
COLD WORDS |
| Agree |
Abnormal |
| Approval |
Afraid |
| Basic |
Cannot |
| Care |
Disagree |
| Fair |
Disappoint |
| Fresh |
Fruitless |
| Fun |
Nonsense |
| Good |
Ruthless |
| Hope |
Underhand |
| Independent |
Unfair |
| New |
Unfortunately |
| Sincere |
Warning |
|
| Source: Harry Mills, Power Points! How to DESIGN & DELIVER Presentations That Sizzle and Sell, AMACOM 2007, p. 74.
|
|
|
|
Words That Sell |
|
Here is a list of some of the most persuasive words in the English language. Use them to persuade and convince and present your case.
| Improve |
Gain |
| Reduce |
Discovery |
| Quick |
Genuine |
| Results |
Easy |
| Effortless |
Clear |
| Save |
You |
| Increase |
Guarantee |
| Proven |
Money |
| Convenient |
Authentic |
| Have |
Safe |
| Thorough |
Respected |
| New |
Unique |
| Original |
Positive |
| Love |
Memorable |
| Promise |
Reliable |
| Yes |
Tested |
|
| Source: Harry Mills, Power Points! How to DESIGN & DELIVER Presentations That Sizzle and Sell, AMACOM 2007, p. 75.
|
|
|
|
Workaround |
|
A reaction to a problem that is focused on minimizing the short-term impact without doing anything to prevent the same problem from occurring in the future. |
| Source: Mark Graban, Lean Hospitals, Improving Quality, Patient Safety, Employee Satisfaction, Ortho-Clinical Diagnostics, Inc. 2009, p. 244.
|
|
|
|
|

|
|