In that we have completed a close look at DMAIC, we began two issues ago a review of some of the Black Belt Tools. In this issue we shall look at the matter of correlation.
The Road Map:
- MSA (Measurement System Analysis)
- Stability (Use a passive control chart)
- Normality (symmetry, use the Anderson Darling Test)
- Co-equal Variances (use Bartlett's or Levene's test)
As we discussed in the last issue, the road map applies to higher order calculations. In the case of correlation, the gated roadmap continues to apply with the exception of number 4. Co-equal variances will not apply to correlation calculations.
Correlation applies when two or more variables appear to interact with each other. An example would be, "if I press harder on the gas peddle, the speedometer goes up, and therefore, they must be correlated". There are many issues where a change in one variable creates a noticeable change in another. The strength of this relationship must be tested in order to create predictive models.
There are many situations where you might want to create a predictable change in one variable by manipulating another. In order to use this model effectively, the correlation between the two subject variables must be clearly understood. If a statistically significant relationship exists, then predictive modeling can be achieved. To this end several statistical relationship calculations can apply. In this article we will look at one of these.
Pearson Correlation:
The calculations are complicated beyond the scope of this article. In this day and age, engineers and Black Belts use software to handle the calculations. All that remains is setting up the data collection and interpreting the results. Practitioners, these days, use Minitab as the software of choice.
Here is a Minitab example for Pearson Correlation:
By following this path the next dialog box will open. Bring the two response variables over. One should be a factor, the other the response.
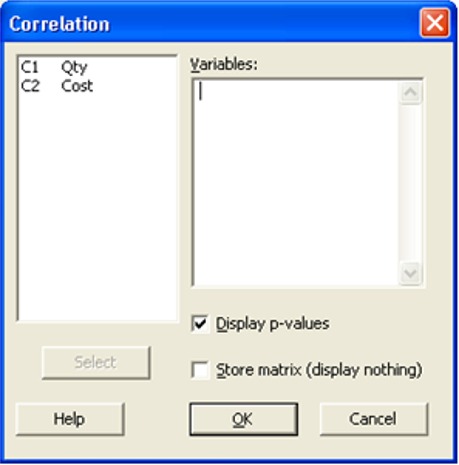
In this case we are testing the correlation between "time & size". Once the calculations are run, the software will identify the Pearson Number.
Interpretation is as follows:
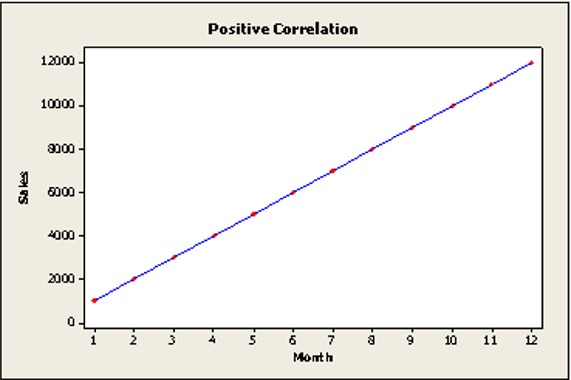
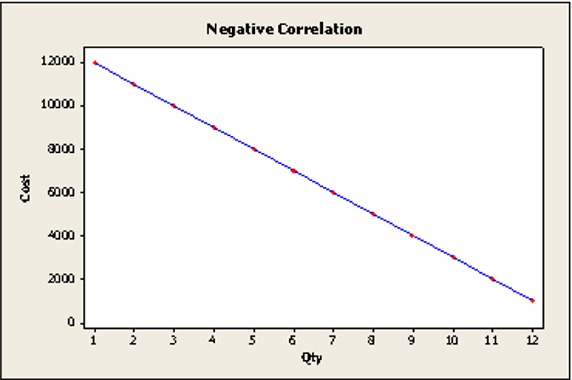
Zero is no correlation and one is a perfect correlation. A negative one is a perfect correlation in a descending model.
The Pearson model will have Zero in the center and negative decimal fractions moving to the left and positive decimal fraction moving the right. Anything .6 or closer to 1 is considered a significant correlation and can be used for predictive modeling.
In the descending direction it would be -.6 to -1.
If a statistical correlation is determined to be the case, then the experimenter can effectively and predictably forecast a change in the response by manipulating the factor variable.